
Market Movement Distribution
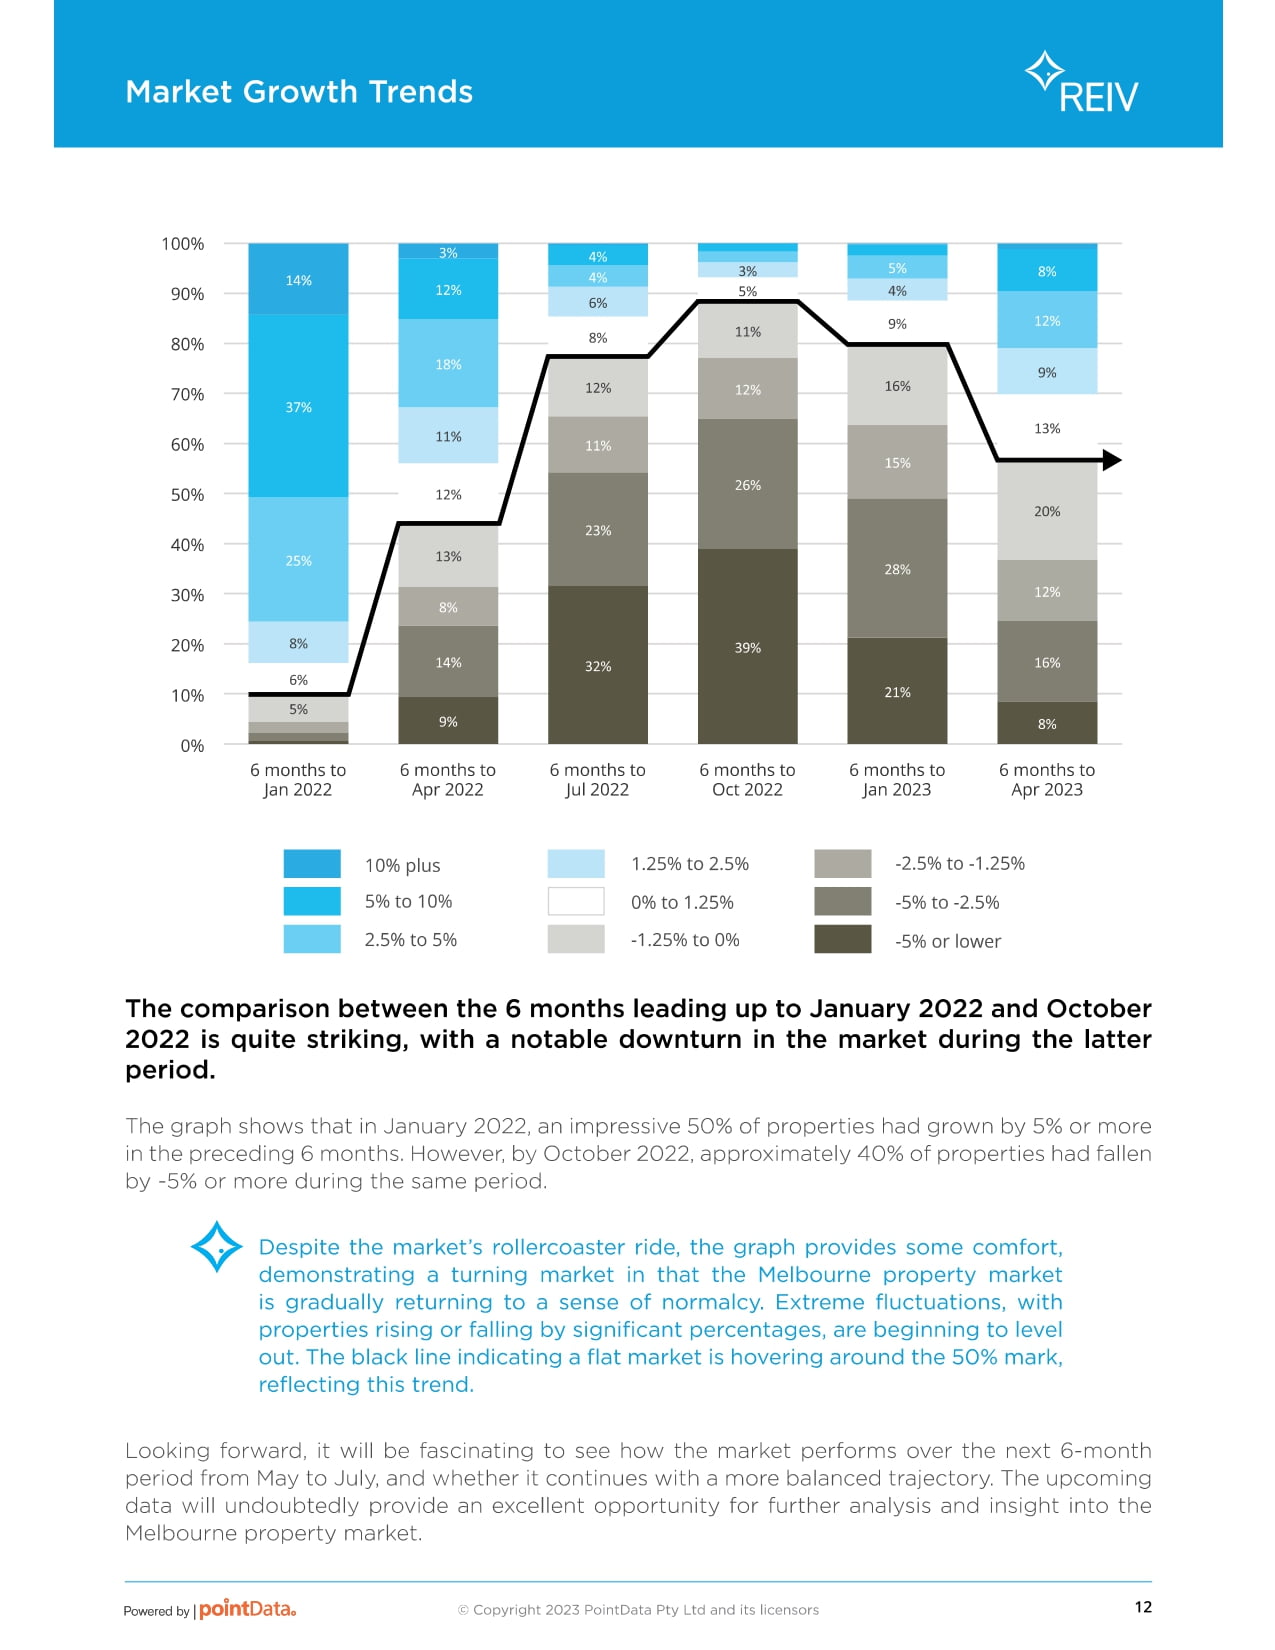
The comparison between the 6 months leading up to January 2022 and October
2022 is quite striking, with a notable downturn in the market during the latter
period.
The graph shows that in January 2022, an impressive 50% of properties had grown by 5% or more
in the preceding 6 months. However, by October 2022, approximately 40% of properties had fallen
by -5% or more during the same period.
Despite the market’s rollercoaster ride, the graph provides some comfort,
demonstrating a turning market in that the Melbourne property market
is gradually returning to a sense of normalcy. Extreme fluctuations, with
properties rising or falling by significant percentages, are beginning to level
out. The black line indicating a flat market is hovering around the 50% mark,
reflecting this trend.
Looking forward, it will be fascinating to see how the market performs over the next 6-month
the period from May to July, and whether it continues with a more balanced trajectory. The upcoming
data will undoubtedly provide an excellent opportunity for further analysis and insight into the
Melbourne property market


