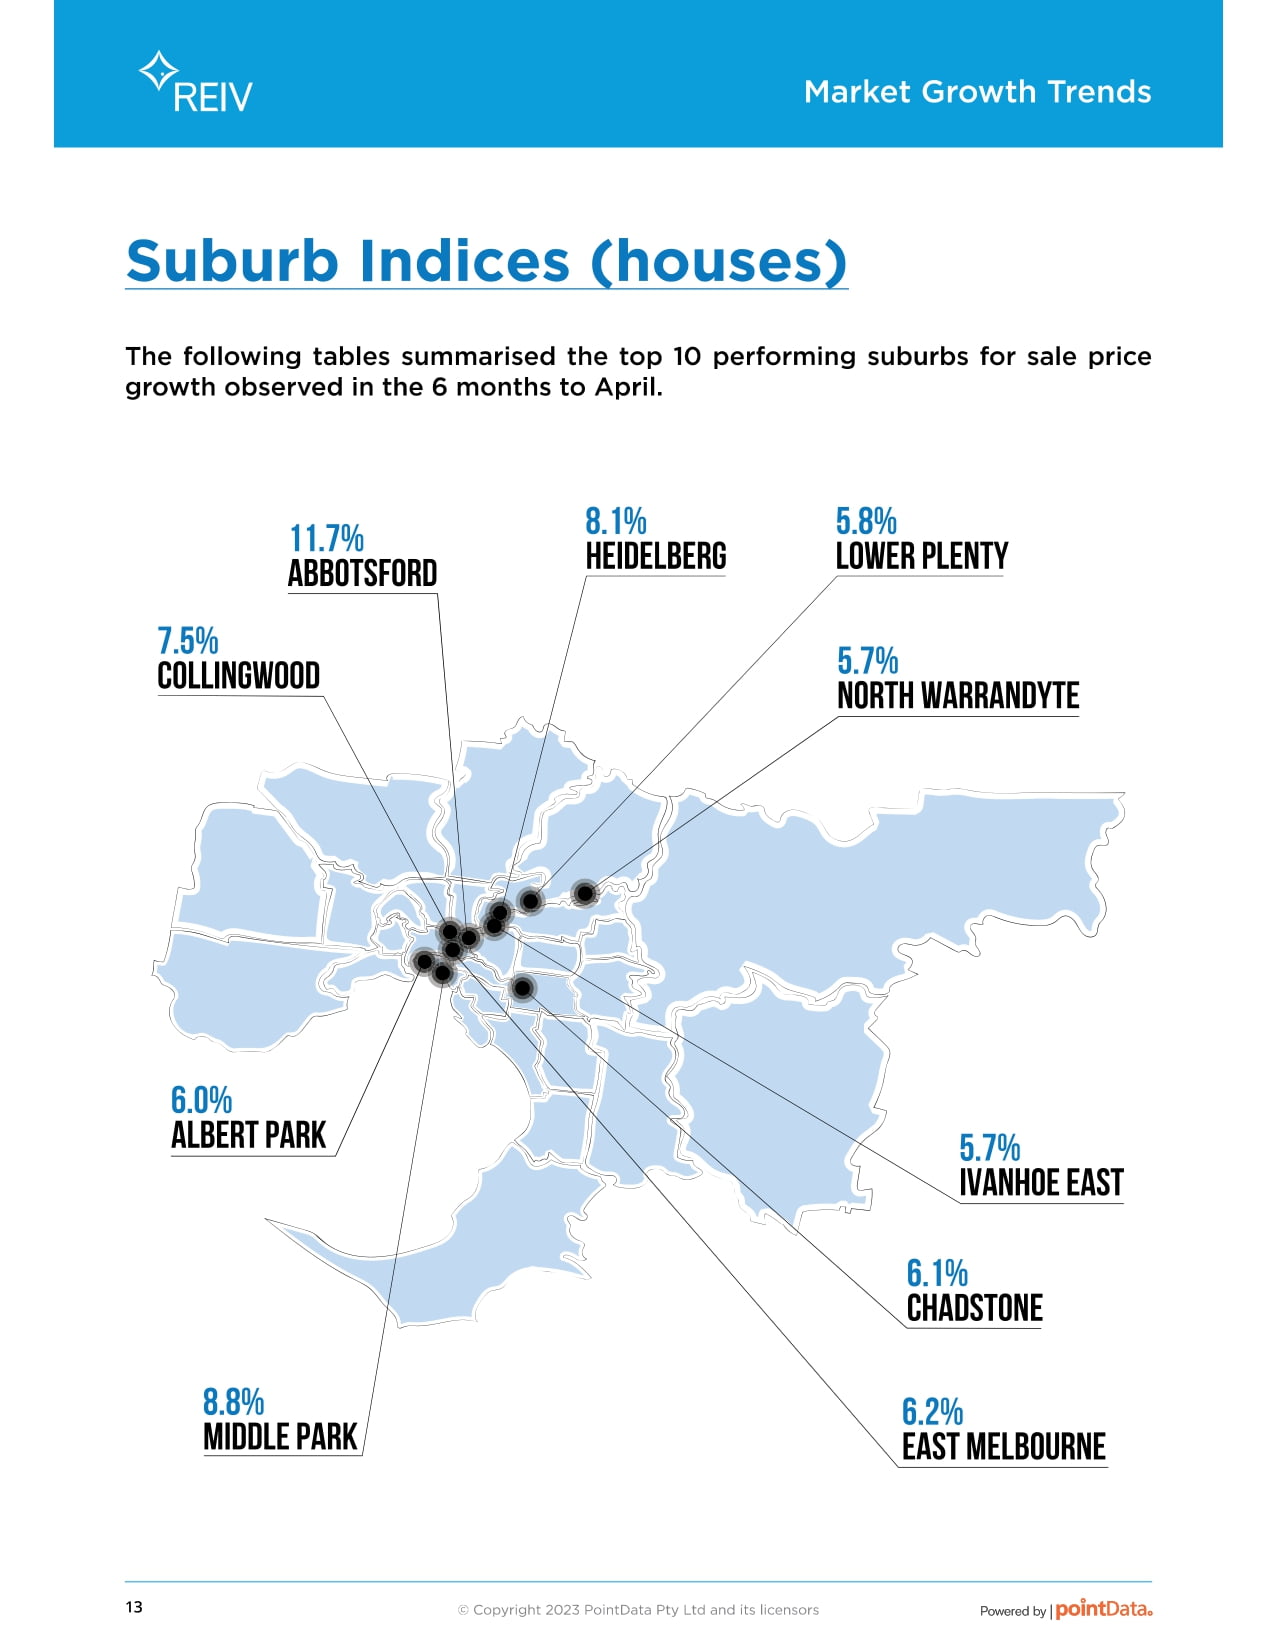
The following tables summarise the top 10 performing suburbs for sale price
growth observed in the 6 months to April.
Suburb Indices (houses)
Market Growth Trends
Powered by
LOWER PLENTY
5.8%
NORTH WARRANDYTE
5.7%
HEIDELBERG
8.1%
COLLINGWOOD
7.5%
CHADSTONE
6.1%
EAST MELBOURNE
6.2%
ALBERT Park
6.0%
MIDDLE PARK
8.8%
IVANHOE EAST
5.7%
ABBOTSFORD
11.7%
Market Growth Trends
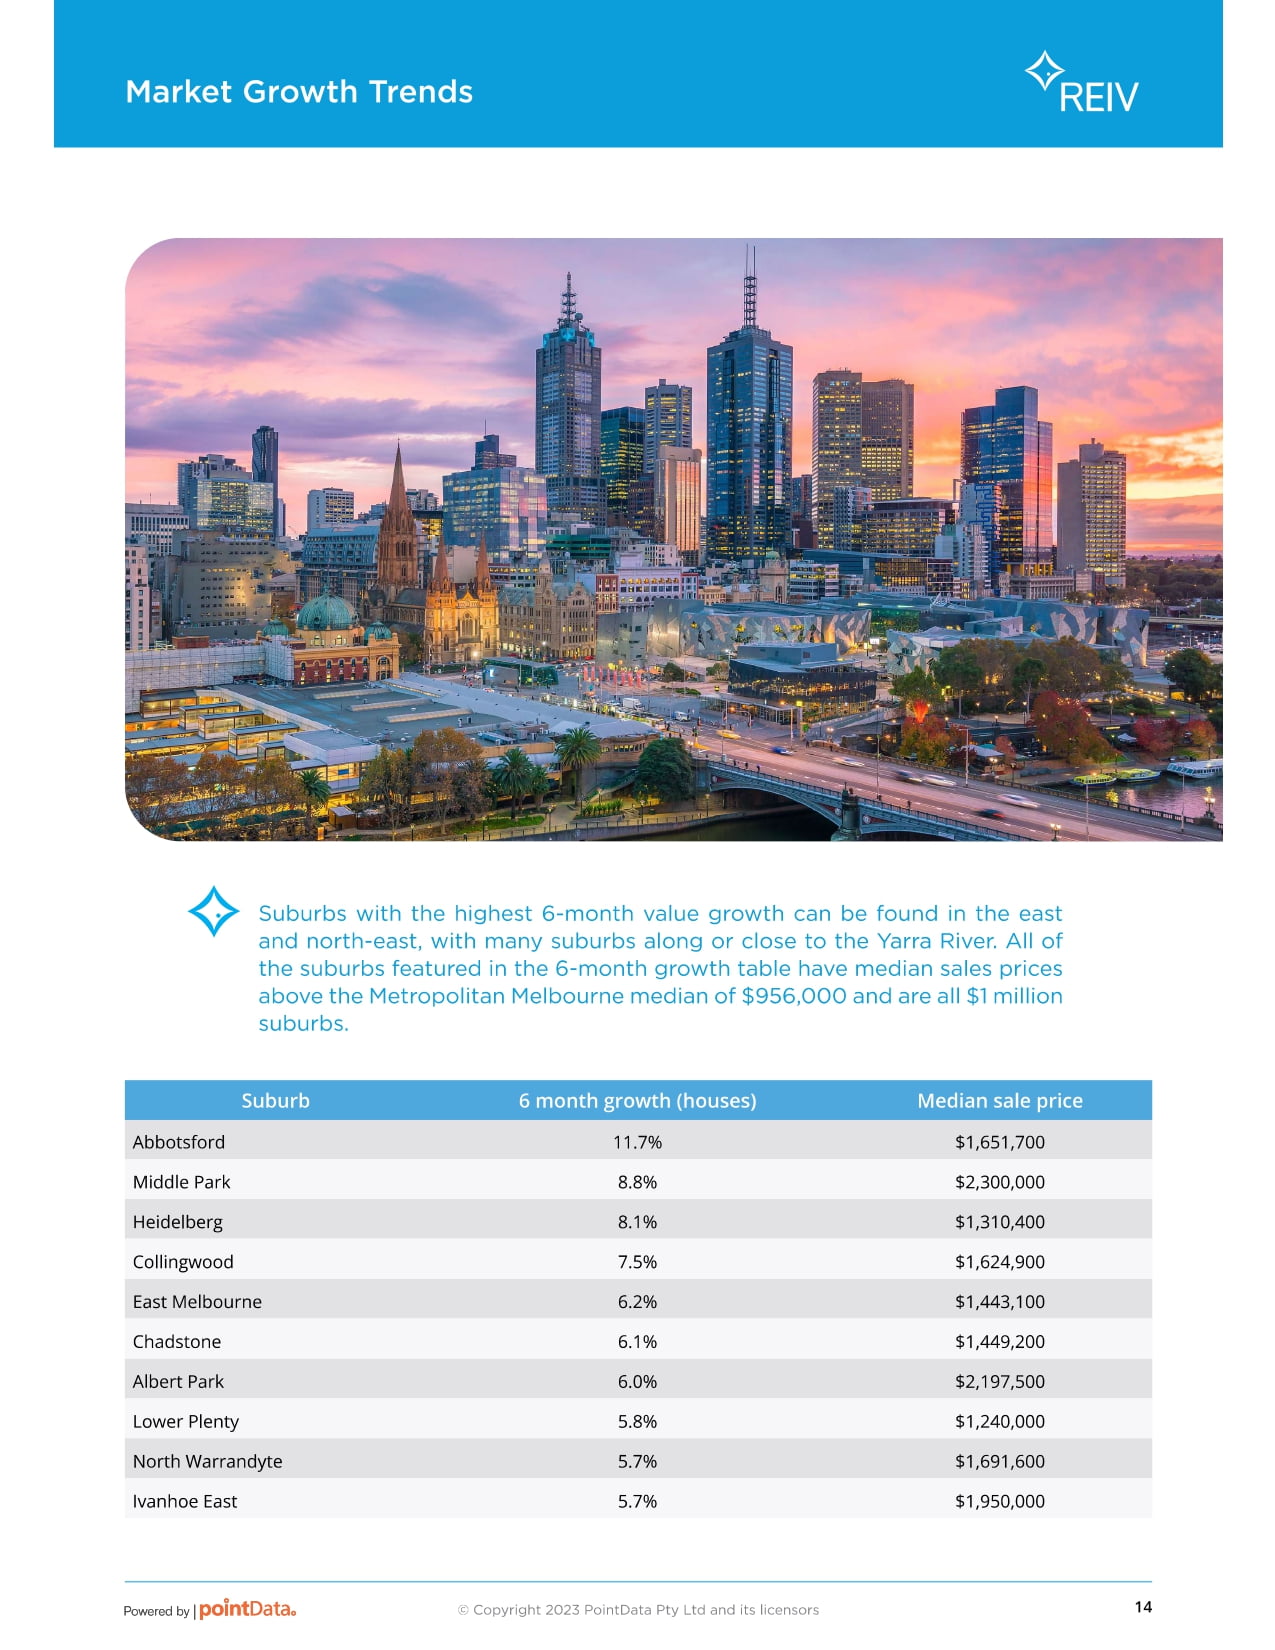
Suburbs with the highest 6-month value growth can be found in the east
and north-east, with many suburbs along or close to the Yarra River. All of
the suburbs featured in the 6-month growth table have median sales prices
above the Metropolitan Melbourne median of $956,000 and are all $1 million
suburbs.
Suburb 6-month growth (houses) Median sale price
Abbotsford 11.7% $1,651,700
Middle Park 8.8% $2,300,000
Heidelberg 8.1% $1,310,400
Collingwood 7.5% $1,624,900
East Melbourne 6.2% $1,443,100
Chadstone 6.1% $1,449,200
Albert Park 6.0% $2,197,500
Lower Plenty 5.8% $1,240,000
North Warrandyte 5.7% $1,691,600
Ivanhoe East 5.7% $1,950,000
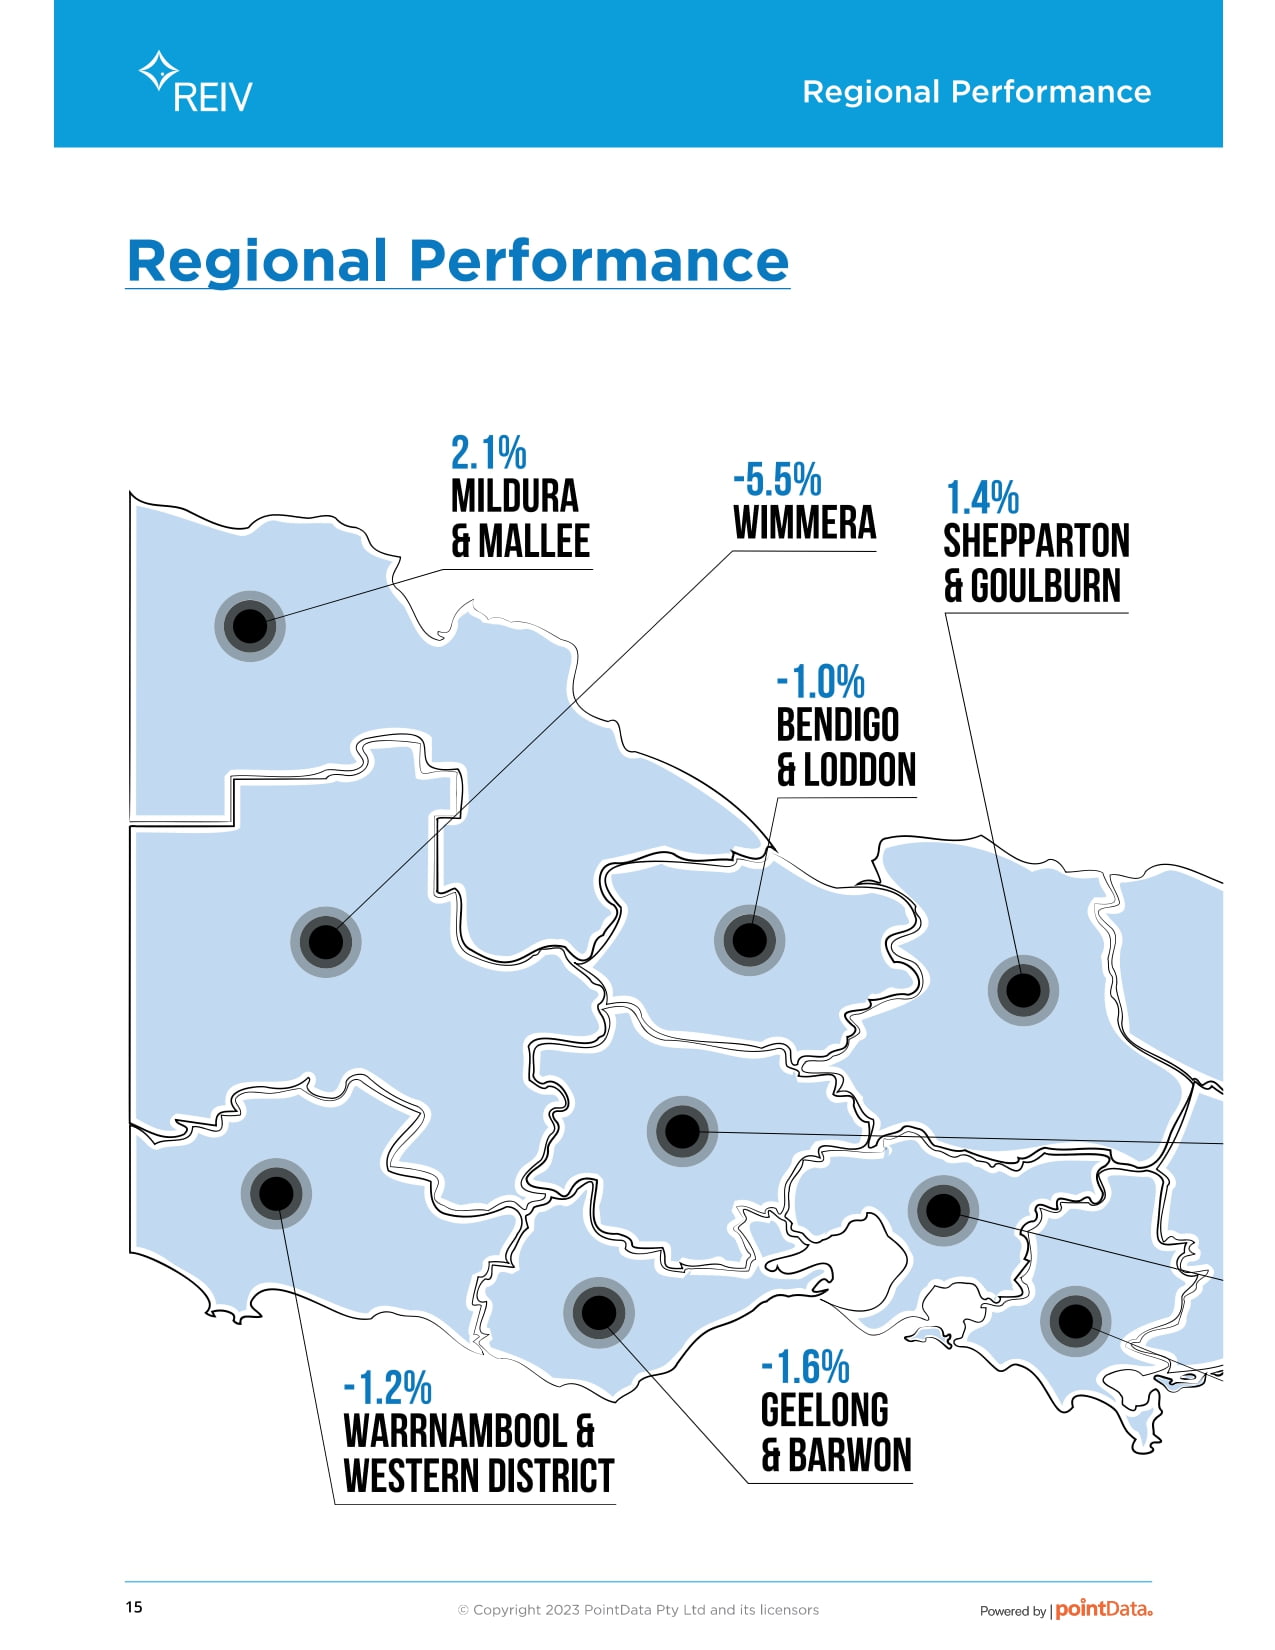
East Gippsland
& Wellington
0.8%
Latrobe Valley
Warrnambool & -1.3%
Western District
-1.2% Geelong
& Barwon
-1.6%
Wodonga &
Ovens-Murray
-0.1%
Metro
-0.3%
Ballarat &
Central Highlands
-0.8%
Shepparton
& Goulburn
Mildura 1.4%
& Mallee
2.1%
Wimmera
-5.5%
Bendigo
& Loddon
-1.0%
Regional Performance
East Gippsland
& Wellington
0.8%
Latrobe Valley
Warrnambool & -1.3%
Western District
-1.2% Geelong
& Barwon
-1.6%
Wodonga &
Ovens-Murray
-0.1%
Metro
-0.3%
Ballarat &
Central Highlands
-0.8%
Shepparton
& Goulburn
Mildura 1.4%
& Mallee
2.1%
Wimmera
-5.5%
Bendigo
& Loddon
-1.0%
Regional Performance
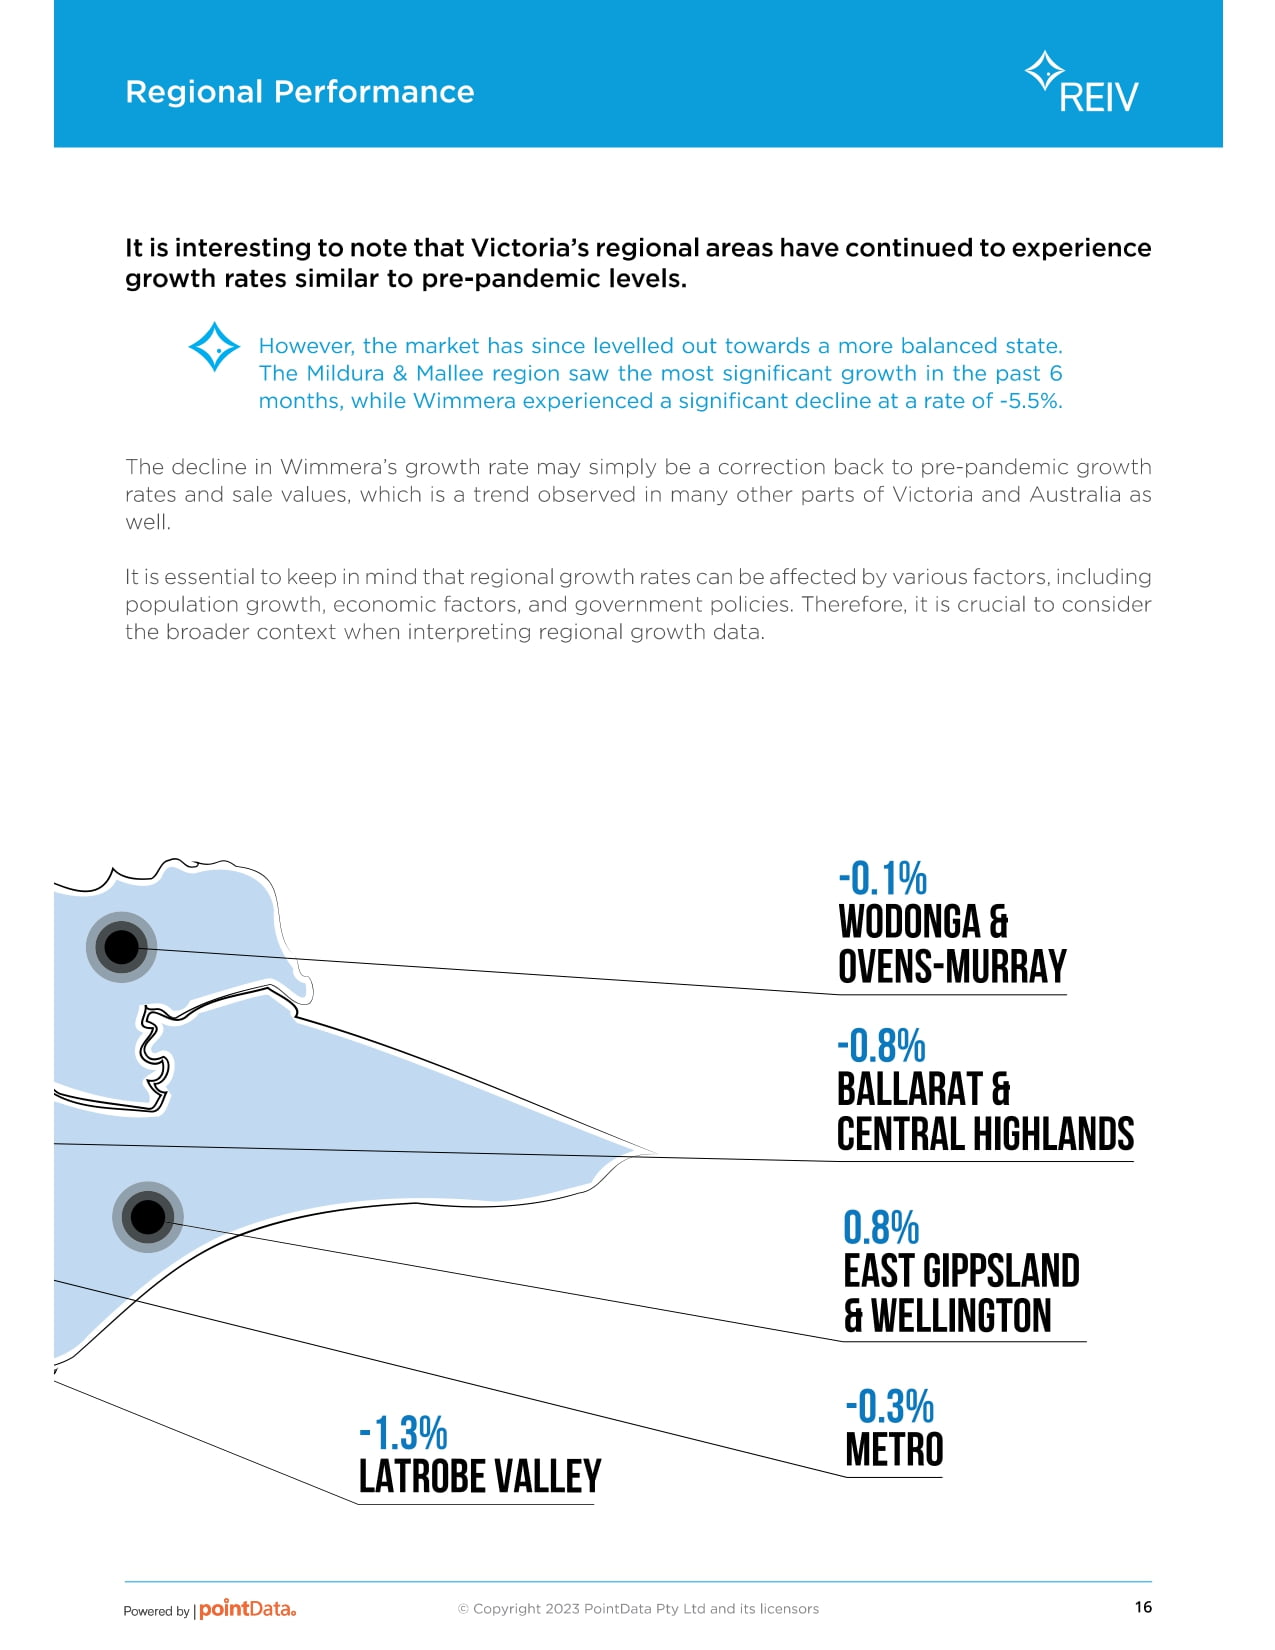
It is interesting to note that Victoria’s regional areas have continued to experience
growth rates similar to pre-pandemic levels.
However, the market has since levelled out towards a more balanced state.
The Mildura & Mallee region saw the most significant growth in the past 6
months, while Wimmera experienced a significant decline at a rate of -5.5%.
The decline in Wimmera’s growth rate may simply be a correction back to pre-pandemic growth
rates and sale values, which is a trend observed in many other parts of Victoria and Australia as
well.
It is essential to keep in mind that regional growth rates can be affected by various factors, including
population growth, economic factors, and government policies. Therefore, it is crucial to consider
the broader context when interpreting regional growth data.
6-month market growth trends
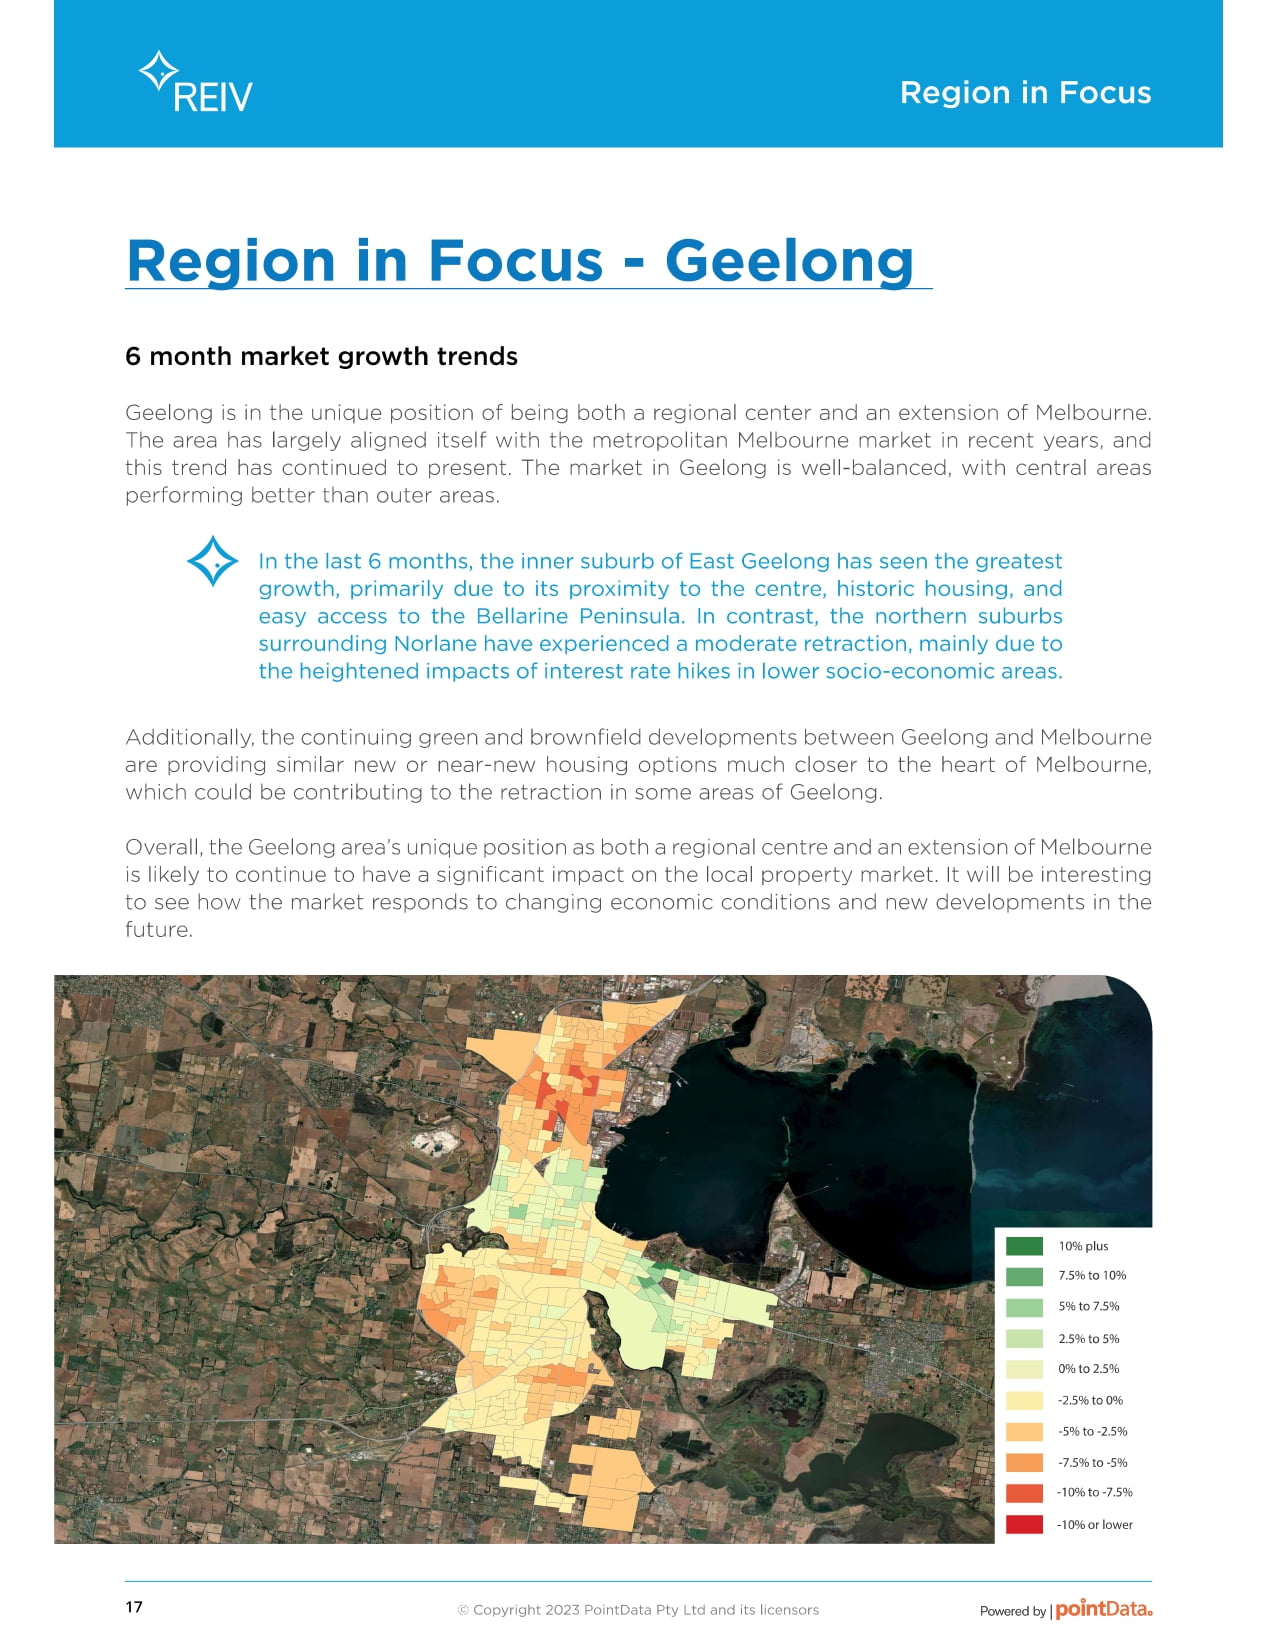
Geelong is in the unique position of being both a regional centre and an extension of Melbourne.
The area has largely aligned itself with the metropolitan Melbourne market in recent years, and
this trend has continued to present. The market in Geelong is well-balanced, with central areas
performing better than outer areas.
In the last 6 months, the inner suburb of East Geelong has seen the greatest
growth, primarily due to its proximity to the centre, historic housing, and
easy access to the Bellarine Peninsula. In contrast, the northern suburbs
surrounding Norlane have experienced a moderate retraction, mainly due to
the heightened impacts of interest rate hikes in lower socio-economic areas.
Additionally, the continuing green and brownfield developments between Geelong and Melbourne
are providing similar new or near-new housing options much closer to the heart of Melbourne,
which could be contributing to the retraction in some areas of Geelong.
Overall, the Geelong area’s unique position as both a regional centre and an extension of Melbourne
is likely to continue to have a significant impact on the local property market. It will be interesting
to see how the market responds to changing economic conditions and new developments in the
future.
Property Price Trends Region in Focus - Geelong 17
Region in Focus
-10% to -7.5%
-10% or lower
-7.5% to -5%
-5% to -2.5%
-2.5% to 0%
0% to 2.5%
2.5% to 5%
5% to 7.5%
7.5% to 10%
10% plus
Median Sale Price
It is not surprising that the median sale prices within Geelong differ based on the varying levels
of amenities. Like many major cities, the inner areas that contain the bulk of Geelong’s desirable
character housing dictate the highest price points. The amenities provided by the Barwon River
and Queens Park further add to the area’s desirability.
As is common in larger cities, median sale prices tend to decrease outwards
from the centre. Efforts to increase housing supply in Melbourne
and Geelong have saturated the market with new housing stock, creating
a starkly different proposition from the relatively close established areas of
Geelong.
This supply has proven significant enough to ensure options in these areas remain affordable
amidst supply and demand imbalances elsewhere in Victoria and Australia.
Overall, the varying median sale prices in Geelong are likely to continue
reflecting the desirability of different areas, as well as the impact of new
housing supply and other economic factors.
It will be interesting to see how the property market in Geelong evolves in the coming years,
particularly as the city continues to position itself as both a regional centre and an extension of
Melbourne.
$500K or lower
$500K to $600K
$600K to $700K
$700K to $800K
$800K to $900K
$900K to $1M
$1M plus