City of Whitehorse
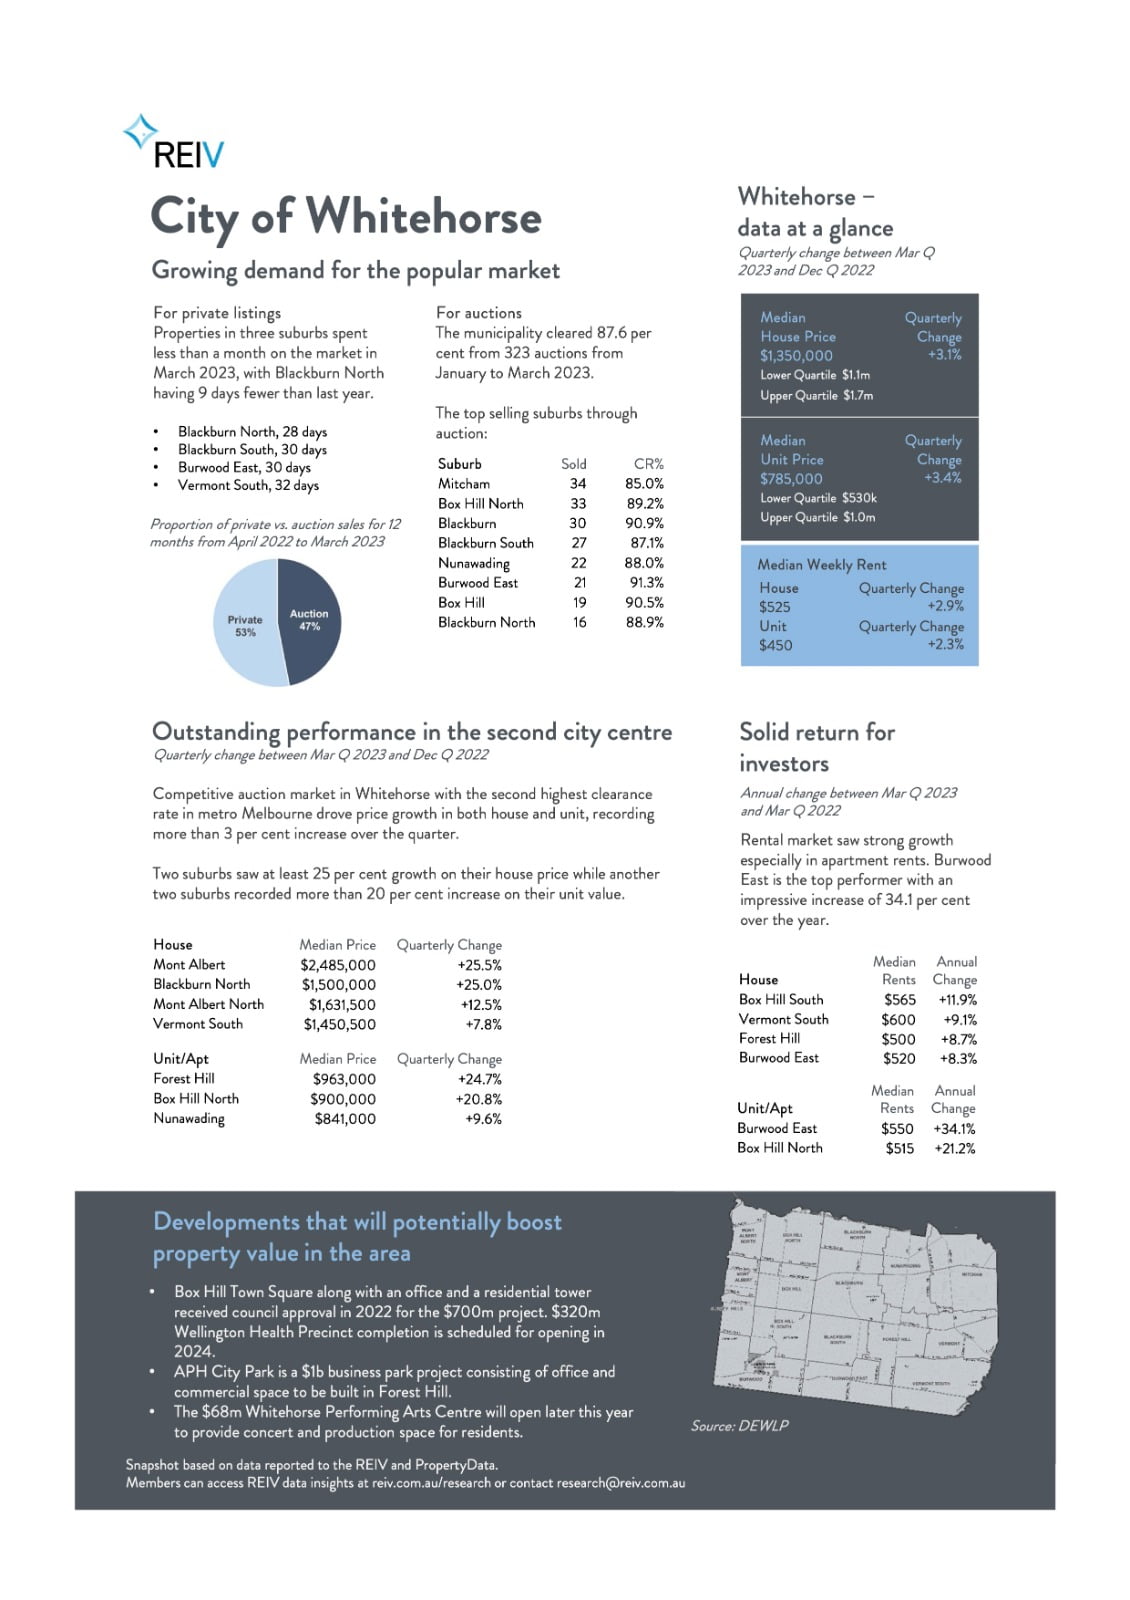
Growing demand for the popular market For private listings Properties in three suburbs spent less than a month on the market in March 2023, with Blackburn North having 9 days fewer than last year. • Blackburn North, 28 days
- Blackburn South, 30 days
- Burwood East, 30 days
- Vermont South, 32 days For auctions
The municipality cleared 87.6 percent of 323 auctions from January to March 2023. The top-selling suburbs through auction:
- Box Hill Town Square along with an office and a residential tower received council approval in 2022 for the $700m project. $320m Wellington Health Precinct completion is scheduled for opening in 2024.
- APH City Park is a $1b business park project consisting of office and commercial space to be built in Forest Hill.
- The $68m Whitehorse Performing Arts Centre will open later this year to provide concert and production space for residents.
Outstanding performance in the second city center Suburb Sold CR%
Mitcham 34 85.0%
Box Hill North 33 89.2%
Blackburn 30 90.9%
Blackburn South 27 87.1%
Nunawading 22 88.0%
Burwood East 21 91.3%
Box Hill 19 90.5%
Blackburn North 16 88.9%
The competitive auction market in Whitehorse with the second highest clearance rate in metro Melbourne drove price growth in both house and unit, recording more than a 3 percent increase over the quarter. Two suburbs saw at least 25 percent growth in their house price while another two suburbs recorded more than a 20 percent increase in their unit value.
Quarterly change between Mar Q 2023 and Dec Q 2022 Median Weekly Rent House Quarterly Change $525 +2.9% Unit Quarterly Change $450 +2.3% Whitehorse – data at a glance Solid return for investors Annual Change Median House Rents
Box Hill South $565 +11.9%
Vermont South $600 +9.1%
Forest Hill $500 +8.7%
Burwood East $520 +8.3%
The rental market saw strong growth, especially in apartment rents. Burwood East is the top performer with an impressive increase of 34.1 percent over the year.
Annual Change Median Unit/Apt Rents
Burwood East $550 +34.1%
Box Hill North $515 +21.2%
Snapshot based on data reported to the REIV and PropertyData. Members can access REIV data insights at reiv.com.au/research or contact research@reiv.com.au
Quarterly change between Mar Q 2023 and Dec Q 2022 Annual change between Mar Q 2023 and Mar Q 2022
House Median Price Quarterly Change
Mont Albert $2,485,000 +25.5%
Blackburn North $1,500,000 +25.0%
Mont Albert North $1,631,500 +12.5%
Vermont South $1,450,500 +7.8%
Unit/Apt Median Price Quarterly Change
Forest Hill $963,000 +24.7%
Box Hill North $900,000 +20.8%
Nunawading $841,000 +9.6%
Median Quarterly House Price Change $1,350,000 +3.1% Lower Quartile $1.1m Upper Quartile $1.7m Median Quarterly Unit Price Change $785,000 +3.4% Lower Quartile $530k Upper Quartile $1.0m Developments that will potentially boost property value in the area
Source: DEWL


